The role of angle axes in the illusions

The one feature common to every variety of Poggendorff figure is a gap, across which alignment must be projected. Of course, both cardinal and angle axes also run across the gaps. Let's propose a simple rule, consistent with the observations we have already made of the cardinal axis effect in the Poggendorff without parallels: wherever the projected alignment intersects with either a cardinal or a figure angle axis, the effect is to push the test line segments out of alignment, as if pushing them apart them away from that axis, without changing their orientation. As before, we ignore the mechanism for now, and just observe the effect.
In the figure to the right, angle axes are shown in blue and cardinal axes in yellow with blue dots. Coloured arrows then indicate the direction in which the targetting arm of the angle appears shifted by the axis concerned. Note to the left that the arrows oppose one another: their effects roughly cancel, and the arm appears aligned with the target dot. In the centre the axes co-operate, and even in this diagram the objectively aligned dot appears misaligned. To the right, the target arm is at an orientation in between vertical and horizontal, so that the effects of the cardinal axes cancel out, and only the figure axis is at work, producing a slight effect of misalignment.
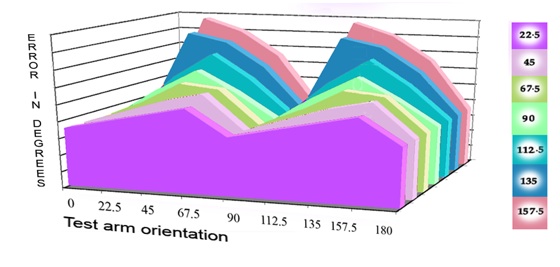
In modelling figure angle axis effects in the sections to follow, I also found that I had to assume that the angle axis contribution is not constant, but varies with orientation. I got the best matches with data by assuming that this effect is strongest when the angle axis is itself vertical or horizontal, falling off in between. That of course meant that different angles yielded maximum affect at different orientations as the figures were rotated. This is as indicated in the lower figure to the right. The blue zone of maximum effect drifts across the range of angles as angle axes rotate through vertical. We can then propose contributions from angles of different sizes varying with rotation as in the figure below.

The axis of the angle, axes, shown in blue, is imagined as shifting the apparent position of the angle arm targetting the dot in the direction of the blue arrow. To the left, this conflicts with an opposed effect (yellow) from the vertical cardinal axis, and the dot still appears roughly aligned with the arm. In the centre, cardinal and figure axes co-operate, and the arm appears (even in this diagram) shifted to the right in relation to the objectively aligned dot. To the right, the targetting arm is rotated midway between vertical and horizontal cardinal axes, and only the angle axis affects apparent arm position.

Angle axes seem to have most effect as they rotate through vertical (coloured zone).
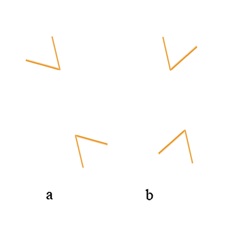
At (a) to the right, test arms appear pretty much aligned. At (b) they appear misaligned. As we saw in the previous section on cardinal axes, if the test arms were seen in isolation rather than as arms of angles, we would expect to see similar misalignment at (a) and (b), so some feature of the angles interacting with the cardinal axes must explain the difference. A candidate would be the axes of the angles. Unlike the cardinal axes, these figure axes may of course be at any orientation, depending on rotation of the figures. Thus they can either co-operate with cardinal axes, to enhance misalignment, or compete with them to reduce it.
Model curves of the contribution to misalignment error from angles of varying size.
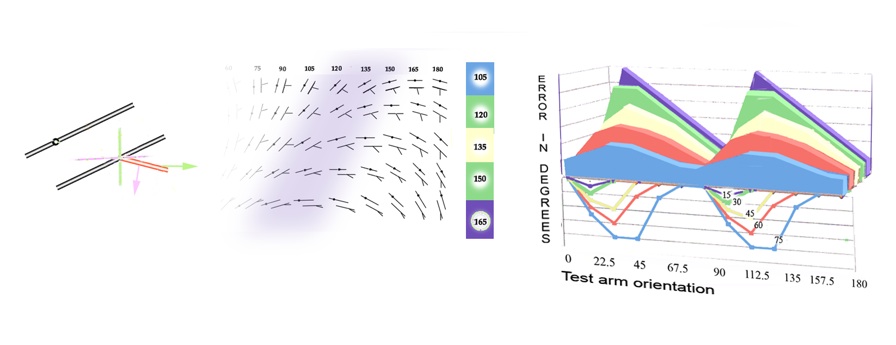
The model above applies to single angles with one arm aiming at a dot target, or for opposed angles with one arm of each aligned. Unfortunately things get a bit more complicated with classic Poggendorff figures, because these present both obtuse angle, and an acute angle. The axis of the acute angle always opposes the effect of the axis of the obtuse angle. This is shown in to the left in the figure below. The opposing axes do not make the same contribution, because, as shown centre below, the larger the obtuse angle, and therefore the greater its effect, the smaller the acute angle, and the less its counter effect. Both contributions however have to be added to the models, and in the graph to the right below the positive contribution from the obtuse angles appears in solid colour, whilst the negative contribution from the acute angles is represented by line graphs.


Classic Poggendorff figures, as at left above, present both an obtuse and an acute angle. The effects of both must be included in models to get a good match with data. The greater the obtuse angle, and therefore the greater its effect, the less the opposing contribution from the acute angles, and vice versa. Positive obtuse angle contributions appear above right in solid colour, negative acute angle effects are shown as line graphs.
At (a), test arms appear aligned, at (b) misaligned. The difference may be due to some angle characteristic, interacting with the cardinal axis.
