Models and data

(i) Weintraub and Brown (1986)
We can now see how well summing the three proposed component agencies producing Poggendorff type misalignments matches experimental data.
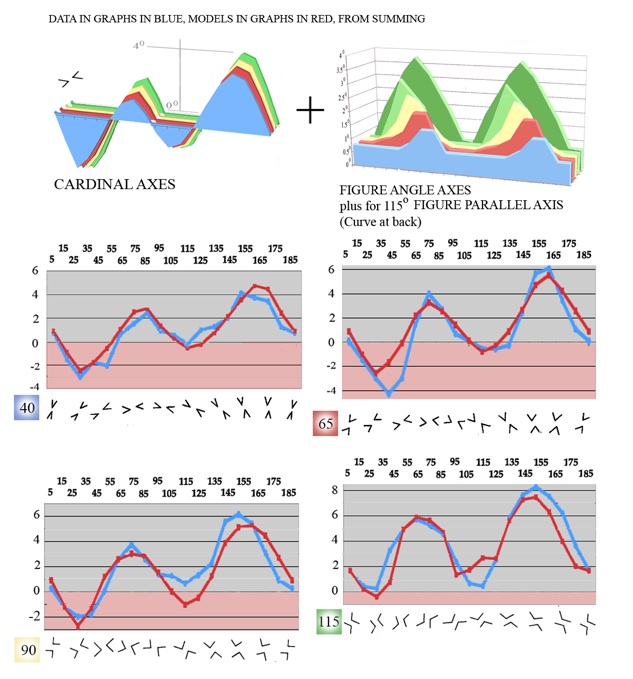
Let us start with figures that do not involve the assimilation effect, to see how just the cardinal axes and angle axes combine. The simplest of the figures for which, thanks to Weintraub and Brown (1986, table 1), we have comprehensive rotational results, are single angles and target dots. The relevant angles and orientations are shown under each graph below. Models are in red, data from experiment in blue. Top centre below is a reminder that for the models we are summing contributions from cardinal axes projected by the viewer onto the figure, and angle axes within the figure.
Note that the graph for a 22.5 degree angle (upper left in the set of graphs below) has an extra curve, in yellow. This is the model curve for the Poggendorff-without-parallels, which appears again in the figure to the far right, along with data from two experimental studies Ninio and O’Regan (1999, their figure 5b) in blue, and Weintraub and Brown (1986, their table 1). The calculation of the model in yellow in that figure was described above in the section above, Cardinal axes. Now looking back to the results for the 22.5 degree angle below, it’s intriguing that for much of the rotation of the test arm in such a small angle, experimental scores (in blue) remain similar to those for the Poggendorff-without-parallels, hugging the yellow model line. Only just anti-clockwise from vertical does the figure angle axis seem aroused, with the data from observation rising briefly to meet the red model line.


The agreement between models and data across all angles is more ragged than I would like, but the data itself is less regular than in the other cases we will look at. Overall, both model and data follow what I have called the signature of these illusions, with the initial dip in scores in each quadrant progressively ironed out as the figure acute angle axis comes to dominate cardinal axes at larger angle sizes.
Model of the effect (in yellow) from cardinal axes alone on a single line and target dot, compared with data from studies by Ninio and O’Regan (1999) and Weintraub and Brown (1986). For details see the section Cardinal axes. Compare with the graph for very small angles, to the upper left. The small angle seems to make little difference.
(ii) My own observations
Next let us see the difference when the assimilation effect has to be added to that of cardinal axes and figure angle axes, because extended inducing arms parallel to one another come into play. This is from a less professional study. The data in Weintraub and Brown’s (1986) study was of course from the observations of a proper sample of observers. By contrast my study of misalignment between the arms of pairs of rotating acute and obtuse angles, in 2003, was based only on my own observations. For each data point, I made six observations, over a couple of weeks, half of them with figures in one handedness, half in another. My experimental procedures are detailed in a final section of this page.
For the three acute angle pairs studied, once again we need only sum the contributions from cardinal and angle axes. The opposed parallels come into play just with the obtuse angle, 115 degree pair. Scores for this pair are notably higher than for the acute angle pairs, and I have added, to account for them, an assimilation component as a fifth pair of peaks, at the back of the stack of figure angle axes to the right below.

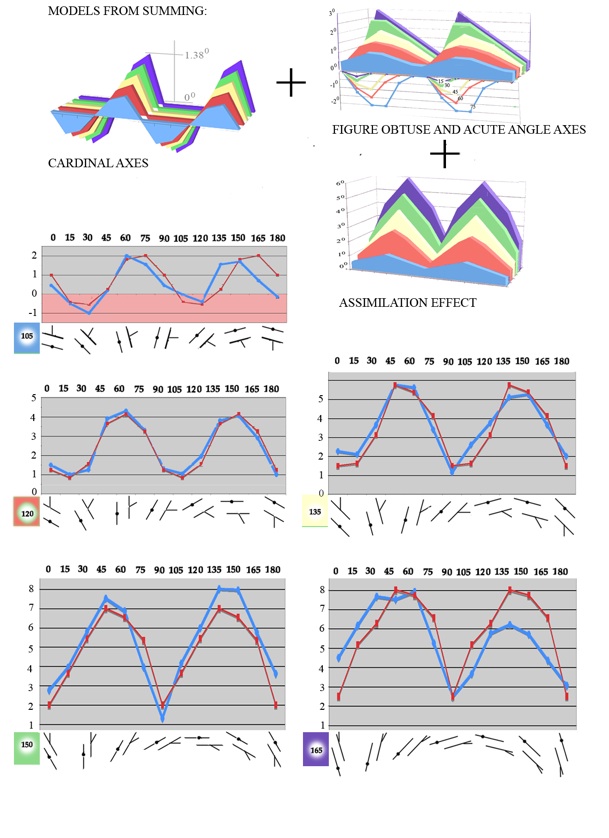
In the previous example, the assimilation effect only came into play in the last of the figures tested. In the final study we will look at, proposed assimilation effects are involved throughout, because the variant of the illusion studied, by Weintraub et al. (1980), is closest of the figures studied here to the classic Poggendorff illusion. However, they reduced the full figure in one respect, choosing a figure with only one test arm and a target dot on the opposed parallel inducing line, because some observers, asked to judge alignment in classic Poggendorff figures, find the task impossible because they see the test arms as lying at different angles. Using one test arm and a target dot avoids the problem, and has been the figure of choice for a number of researchers. It gives results close to those for two-test-armed versions. For example Ninio and O’Regan compared data for one-armed and classic figures and reported good agreement (1999, their figure 9).
With these single test arm figures, as with classic Poggendorff figures, figure acute as well as figure obtuse angle axes come into play, as explained above in the section Angle axes, besides Cardinal axial effects and the proposed Assimilation effect.
(iii) Weintraub et al (1980)

Data replotted from Weintraub et al. (1980, figure 1) in blue compared with models in red. Curves of similar colour in the stacks of contributions are summed: from the cardinal axis effect at upper left; from figure obtuse (positive effect) and figure acute angles (negative effect) at upper right; and from an assimilation effect (positive), below. The assimilation effect is maximal with test arms at 45 and 135 degrees.
The match between models and data is perhaps the best of our three comparisons, and again both models and data show the proposed signature shift, from dominance by the cardinal axial contribution at smaller obtuse angles to dominant figure axis effect, especially from the assimilation component, at larger angles.
Models in red, with data in blue replotted from Weintraub and Brown (1986, table 1), for individual angle sizes. Curves of similar colour in the stacks of model contributions at top right from cardinal (top) and figure axes (below) are summed for each angle size. For the smallest angle (top left) the cardinal axis contribution is added in yellow: at this small angle size, results only briefly depart from those for the Poggendorff without parallels.
Data (blue) from the author’s 2003 study compared with models (red). Curves of similar colour in the stacks of model contributions at top right are summed for each angle size. For the 115 degree angles, an effect (shown at the rear of the stack top right, with maxima with test arms at 45 and 135 degrees) attributed to assimilation of the alignment track to the overall orientation of the figures has to be added in, as well as the effect of the figure angle axis.